Number of FTEs that perform the process group "plan for and align supply chain resources" per $1 billion revenue

This measure calculates the total number of full-time equivalent employees (FTEs) per $1 billion revenue to perform the process group "plan for and align supply chain resources," which involves developing sound strategies for production; handling demand for products/services; administering master production schedules; and establishing quality standards and procedures. It is part of a set of Staff Productivity measures that help companies assess the efficiency of their staff related to the process "plan for and align supply chain resources."
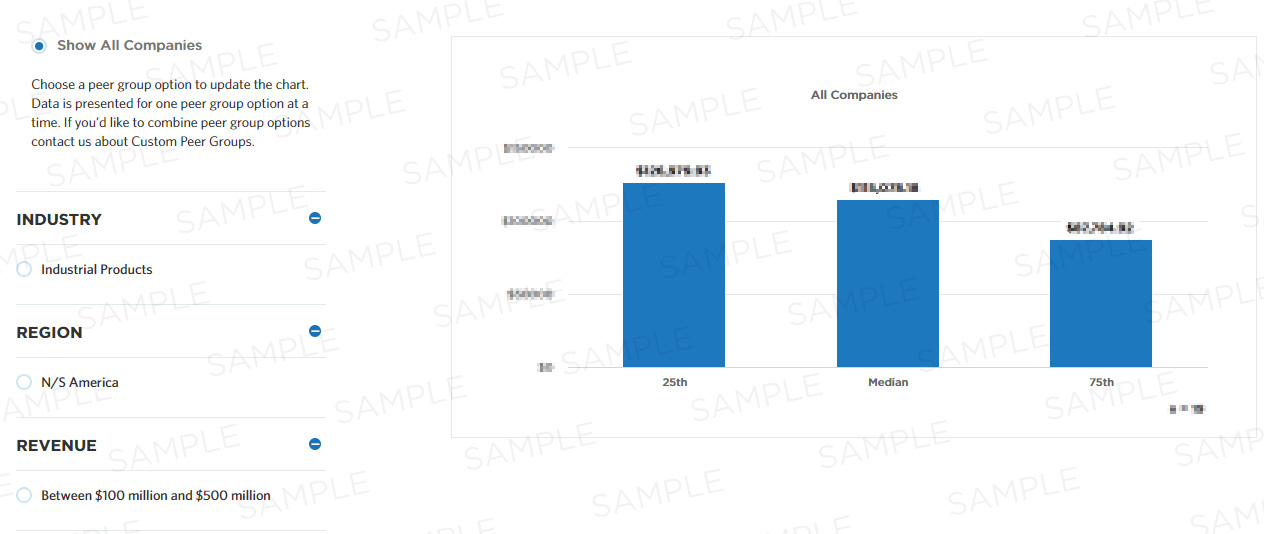
Benchmark Data

Lock

Sorry! Not all users have access to all of our resources.

Want to unlock access to all of our resources?

Learn about Membership Arrow with stem

Measure Category:
Process Efficiency
Measure ID:
101218
Total Sample Size:
1,799 All Companies
Performers:
25th Median 75th
- - -
Key Performance Indicator:
Yes

Sample image showing interactive filters for more detailed measure peer group data and an interactive graph.

Compute this Measure

Units for this measure are FTEs.

Back to Top

Number of FTEs who perform the process group "plan for and align supply chain resources" / (Total business entity revenue * .000000001)

Key Terms

Back to Top

Total Annual Revenue/Net Revenue

Total annual revenue is net proceeds generated from the sale of products or services. This should reflect the selling price less any allowances such as quantity, discounts, rebates and returns. If your business entity is a support unit and therefore does not directly generate revenue, then provide the revenue amount for the units you support. For government/non-profit organizations, please use your non-pass-through budget. For insurance companies the total annual revenue is the total amount of direct written premiums, excluding net investment income. Note: Business entity revenue needs to only include inter-company business segment revenue when the transactions between those business segments are intended to reflect an arm's length transfer price and would therefore meet the regulatory requirements for external revenue reporting.

FTE - (full-time equivalent employee)

To calculate the number of full-time equivalents employed during the year for each respective process or activity, you must prorate the number of employees and the hours spent performing each process/activity. Assume that a full-time worker represents 40 hours per week. Provide the average number of full-time equivalents employed during the year for each respective process. Include full-time employees, part-time employees, and temporary workers hired during peak demand periods. Allocate only the portion of the employee's time that relates to or supports the activities identified for an applicable process. Prorate management and secretarial time by estimating the level of effort in support of each activity, by process.

For example, a part-time secretary in the finance department for XYZ, Inc. charges all of his time to finance department activities. He works 20 hours per week. The secretary splits his time evenly supporting employees working in the general accounting process and the financial reporting process. Thus, his time should be allocated by process. So, if he works throughout the year and supports these two processes, his time would be split evenly as:

20hrs/40hrs = .5FTE * 50% for general accounting = .25FTE for general accounting

20hrs/40hrs = .5FTE * 50% for financial reporting = .25FTE for financial reporting

Staff Productivity

Staff Productivity is a measure of the efficiency of individuals performing specific processes. Measures in staff productivity generally relate the transaction volume or outcome of the process with the effort in terms of full time equivalent employees to perform the process.

Median

The metric value which represents the 50th percentile of a peer group. This could also be communicated as the metric value where half of the peer group sample shows lower performance than the expressed metric value or half of the peer group sample shows higher performance than the expressed metric value.

Measure Scope

Back to Top

Cross Industry (7.3.1)

  • 4.1.1 - Develop production and materials strategies (10221)
    • 4.1.1.1 - Define manufacturing goals (10229)
    • 4.1.1.2 - Define labor and materials policies (10230)
    • 4.1.1.3 - Define outsourcing policies (10231)
    • 4.1.1.4 - Define capital expense policies (10232)
    • 4.1.1.5 - Define capacities (10233)
    • 4.1.1.6 - Define production network and supply constraints (10234)
    • 4.1.1.7 - Define production process (14193)
    • 4.1.1.8 - Define standard operating procedures (19551)
    • 4.1.1.9 - Define production workplace layout and infrastructure (14194)
  • 4.1.2 - Manage demand for products (10222)
    • 4.1.2.1 - Develop baseline demand forecasts (10235)
    • 4.1.2.2 - Collaborate demand with customers (10236)
    • 4.1.2.3 - Develop demand consensus forecast (10237)
    • 4.1.2.4 - Determine available to promise (10238)
    • 4.1.2.5 - Monitor activity against demand forecast and revise forecast (10239)
    • 4.1.2.6 - Evaluate and revise demand forecasting approach (10240)
    • 4.1.2.7 - Measure demand forecast accuracy (10241)
  • 4.1.3 - Create materials plan (10223)
    • 4.1.3.1 - Create unconstrained plan (10242)
    • 4.1.3.2 - Collaborate with supplier and contract manufacturers (10243)
    • 4.1.3.3 - Identify critical materials and supplier capacity (10244)
    • 4.1.3.4 - Monitor material specifications (10245)
    • 4.1.3.5 - Generate constrained plan (10246)
    • 4.1.3.6 - Define production balance and control (14196)
  • 4.1.4 - Create and manage master production schedule (10224)
    • 4.1.4.1 - Model production network to enable simulation and optimization (20023)
    • 4.1.4.2 - Create master production schedule (20024)
    • 4.1.4.3 - Maintain master production schedule (17041)
  • 4.1.5 - Plan distribution requirements (17042)
    • 4.1.5.1 - Maintain master data (10252)
    • 4.1.5.2 - Determine finished goods inventory requirements at destination (10253)
    • 4.1.5.3 - Determine product storage facility requirements (19555)
    • 4.1.5.4 - Calculate requirements at destination (10254)
    • 4.1.5.5 - Calculate consolidation at source (10255)
    • 4.1.5.6 - Manage collaborative replenishment planning (10256)
    • 4.1.5.7 - Calculate and optimize destination dispatch plan (10258)
    • 4.1.5.8 - Manage dispatch plan attainment (10259)
    • 4.1.5.9 - Calculate and optimize destination load plans (10260)
    • 4.1.5.10 - Manage partner load plan (10261)
    • 4.1.5.11 - Manage cost of supply (10262)
    • 4.1.5.12 - Manage capacity utilization (10263)
  • 4.1.6 - Establish distribution planning constraints (10226)
    • 4.1.6.1 - Establish distribution center layout constraints (10267)
    • 4.1.6.2 - Establish inventory management constraints (10268)
    • 4.1.6.3 - Establish transportation management constraints (10269)
    • 4.1.6.4 - Establish storage management constraints (19558)
  • 4.1.7 - Review distribution planning policies (10227)
    • 4.1.7.1 - Review distribution network (10264)
    • 4.1.7.2 - Establish sourcing relationships (10265)
    • 4.1.7.3 - Establish dynamic deployment policies (10266)
  • 4.1.8 - Develop quality standards and procedures (10368)
    • 4.1.8.1 - Establish quality targets (10371)
    • 4.1.8.2 - Develop standard testing procedures (10372)
    • 4.1.8.3 - Communicate quality specifications (10373)