Average time-to-profitability in months for existing product/service improvement and extension projects
This measure calculates the average number of months that elapse from the start of the "design and develop product/service" process (when resources are first assigned) to the point at which an existing product/service improvement or extension project is sold at a profit. The cycle time begins with the "design and develop product/service" process (when resources are first assigned) and ends when the product/service is ready for sale. Existing product/service extensions result in new applications of existing products/services whereas existing product/service improvements focus on improving the customer experience. This measure is part of a set of Cycle Time measures that help companies analyze the duration of the process "develop and manage products and services" from beginning to end.
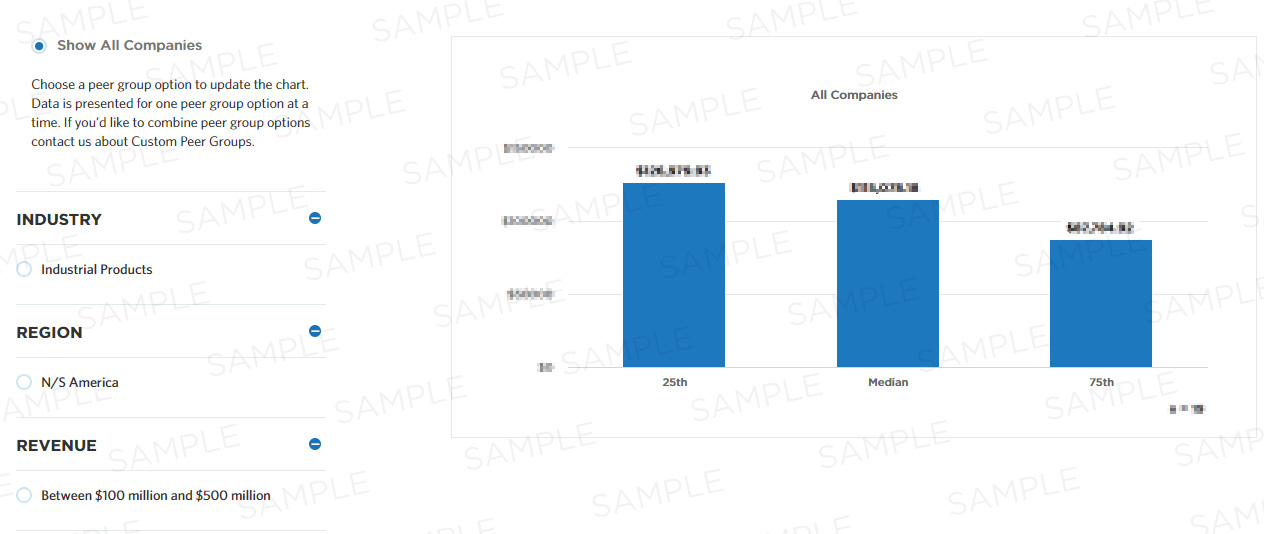
Benchmark Data
| 25th | Median | 75th |
|---|---|---|
| - | - | - |
Compute this Measure
Units for this measure are months.
Average time-to-profitability in months for existing product/service improvement projects
Key Terms
Cycle Time
Cycle time is the total time from the beginning of the process to the end. This includes both time spent actually performing the process and time spent waiting to move forward.
Median
The metric value which represents the 50th percentile of a peer group. This could also be communicated as the metric value where half of the peer group sample shows lower performance than the expressed metric value or half of the peer group sample shows higher performance than the expressed metric value.