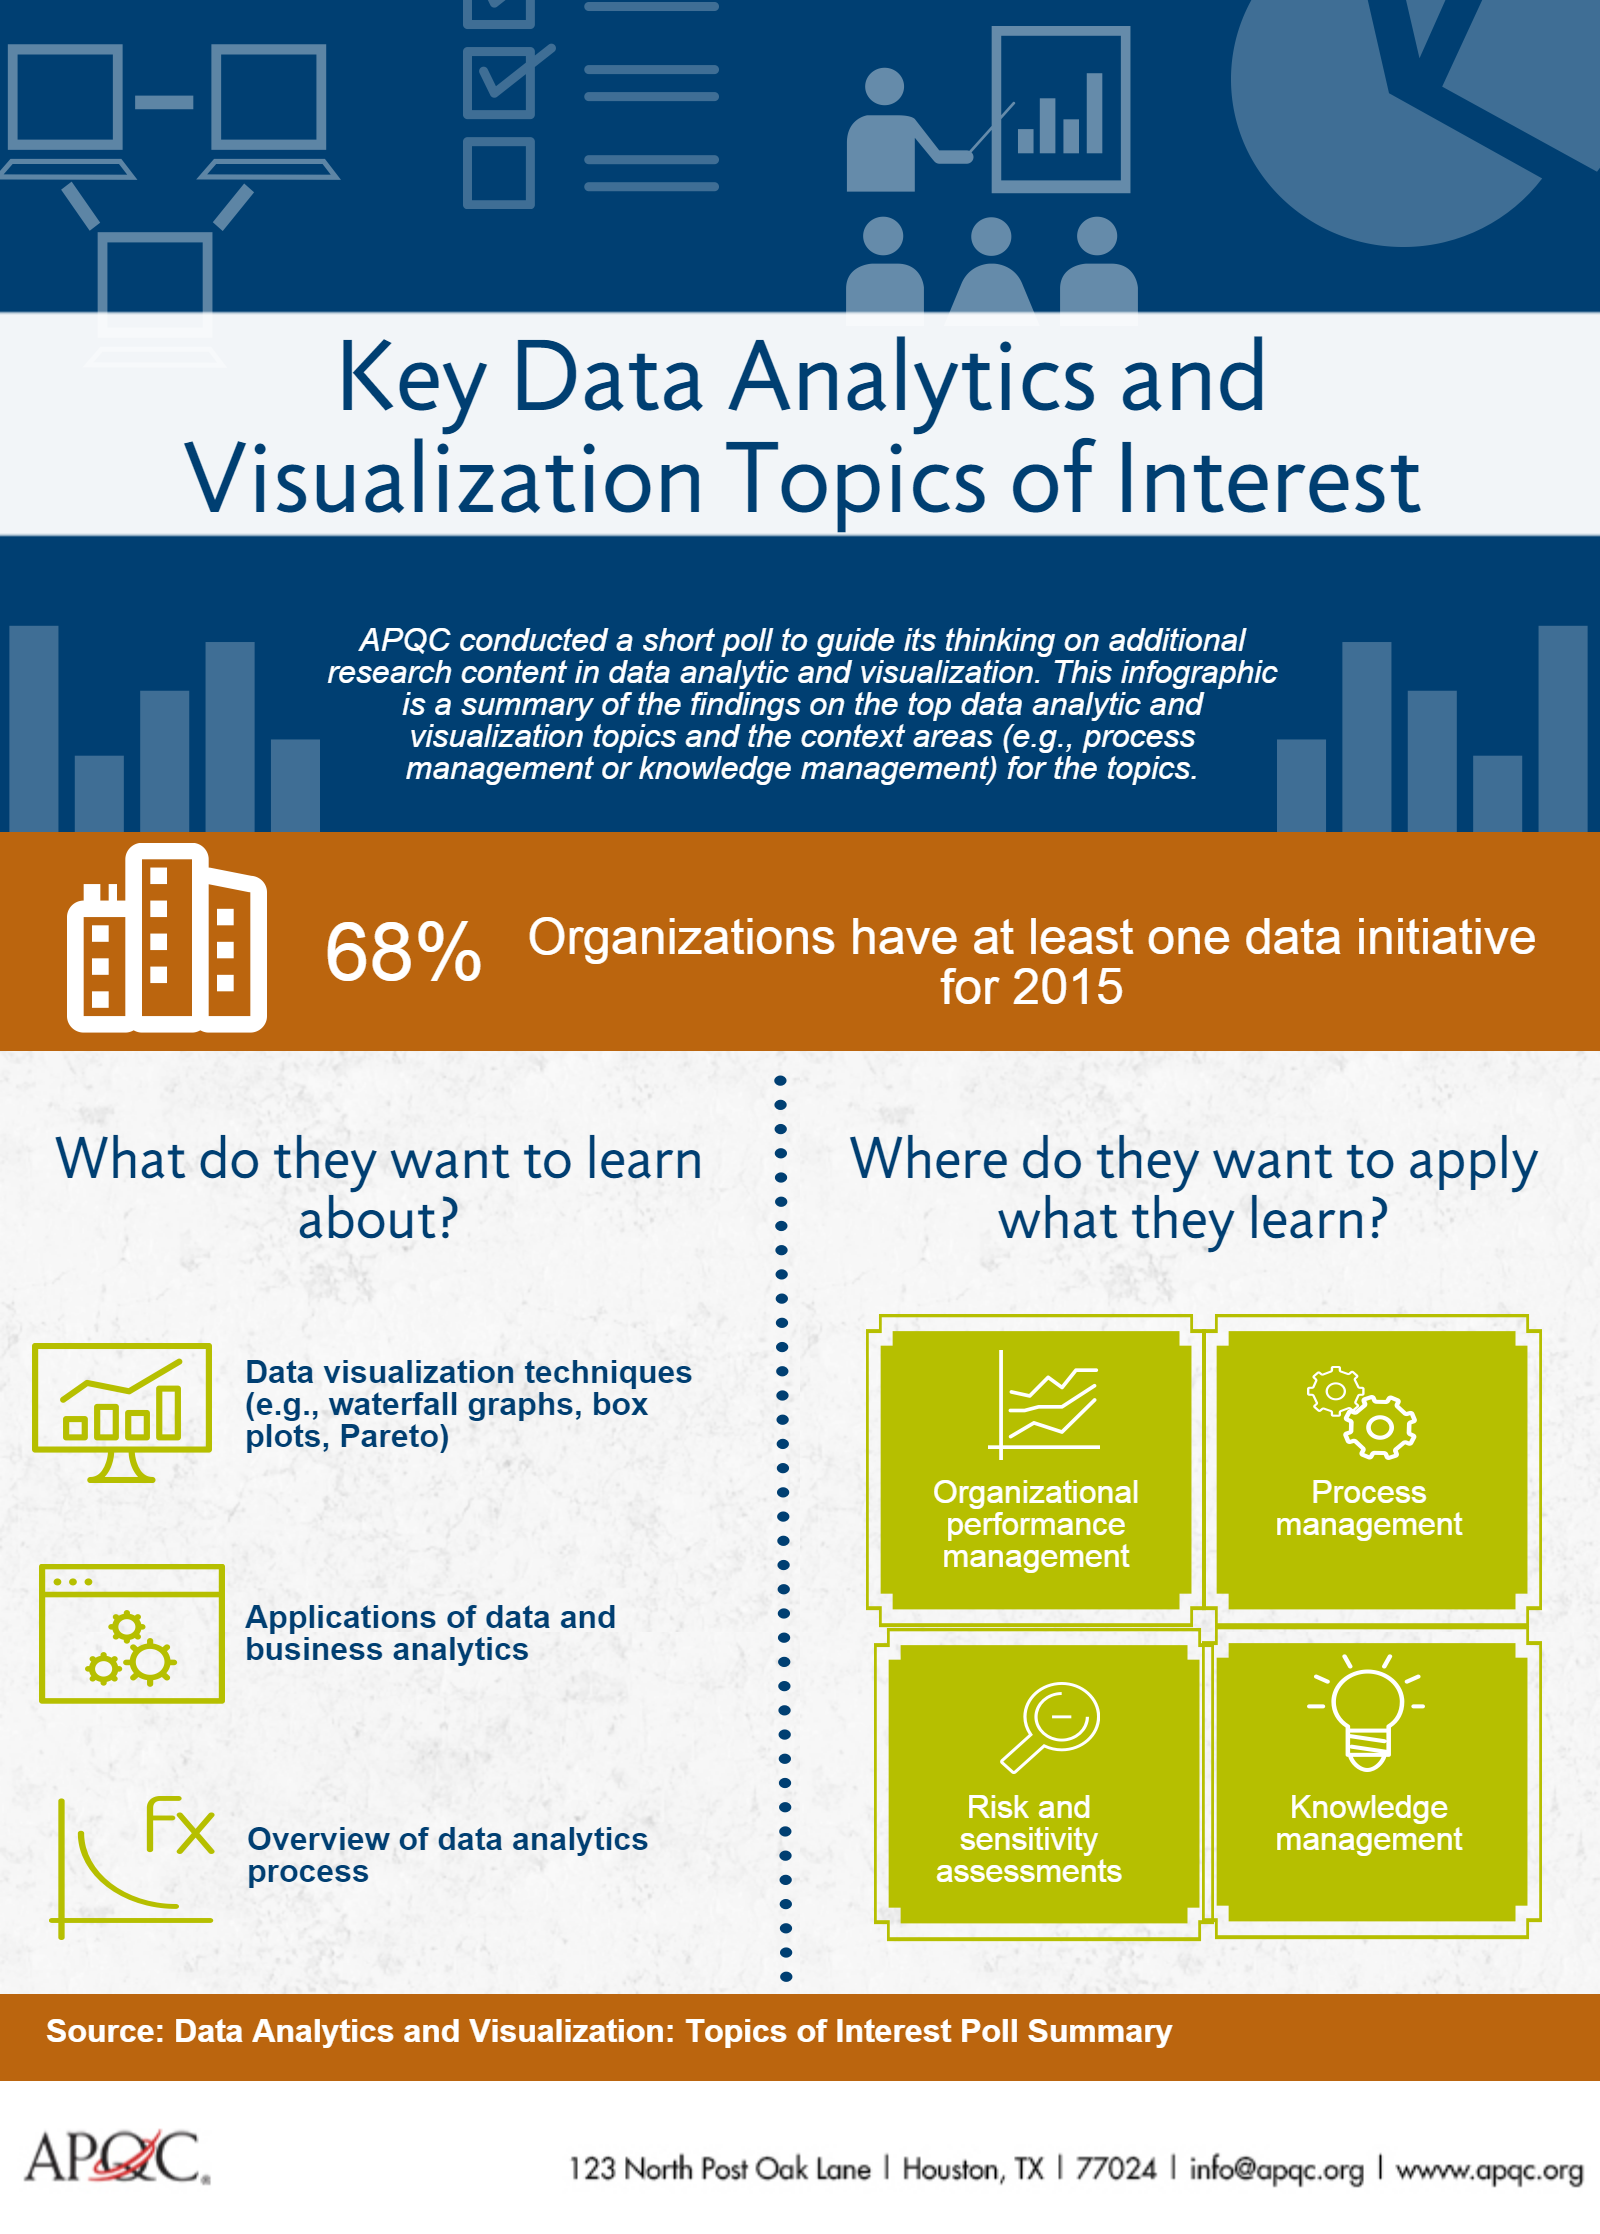
Due to the popularity of its recent webinar Best Practices in Data Visualization, APQC conducted a short poll to guide its thinking on additional research content in data analytics and visualization. This infographic is a summary of the findings on the top data analytics and visualization topics and the context areas (e.g., process management or knowledge management) for the topics.
Download a PDF of the infographic here.
Want more information on applications of data and business analytics? Join us on Tuesday, September 24th for a complimentary webinar, Next-Level Benchmarking: Applying Process Analytics for Effective Decision Making, where we will explore APQC’s methodology for driving decision making using process performance and benchmarking data.
Want more information on data visualization techniques? Check out our Benchmarking and Improvement Tools (Collection).
For more process and performance management research and insights follow me on twitter at @hlykehogland or connect with me on