Articles
|
April 20, 2026
Benchmarking the Total Cost of Procurement
c: 1784549754
Historically, many organizations viewed procurement simply as a spend center. Today, leading organizations view procurement as a strategic opportunity for process improvement, cost savings, and increased customer satisfaction. Improving the efficiency and effectiveness of the procurement process group can lead to lower costs and better supplier relationships.
Cost measures are traditional measures used in evaluating process performance, and often the first key performance indicators that executives look at since they are financial measures. Total cost of the procurement process group per $1,000 in revenue is a key measure of the cost of the entire procurement function. Total costs include personnel, systems, outsourcing, any allocated overhead, and other costs for procurement.
Procurement process group costs per $1,000 in revenue can vary from organization to organization based on procurement costs (the numerator) and the volume of revenue (the denominator). By using a common denominator, or normalizing, the measure, it is easier to compare costs across organizations of different sizes.
As illustrated in Figure 1, APQC’s Open Standards Benchmarking® in procurement shows that there is a substantial difference between top performers and bottom performers (and even the median level of performance) with respect to the total cost to perform the procurement process group per $1,000 in revenue. Top performers are defined as organizations with costs at the 25th percentile or lower, and bottom performers are organizations with costs at the 75th percentile or higher. Top performers spend $5.19 less per $1,000 in revenue for this group of processes than bottom performers. For an organization with $2 billion in annual total revenue, this difference in costs represents potential savings of over $10.3 million per year.
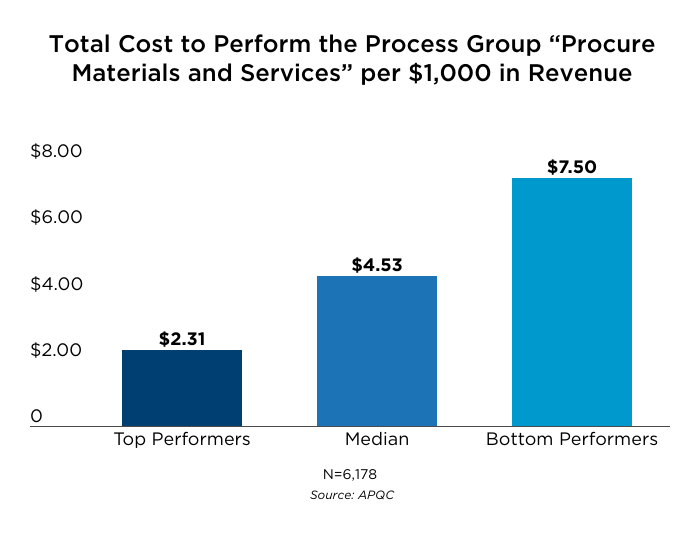
Fig. 1
If we compare the total cost of procurement per $1,000 in revenue for direct materials and services against that of indirect materials and services, we see that procurement costs are higher for indirect materials and services. Compared to bottom performers, top performers spend $1.91 less and $2.30 less per $1,000 in revenue for direct and indirect materials and services, respectively (Figures 2 and 3). For an organization with $2 billion in annual total revenue, this difference in costs represents potential savings of over $3.8 million for direct materials and services and $4.6 million per year for indirect materials and services.

Fig. 2
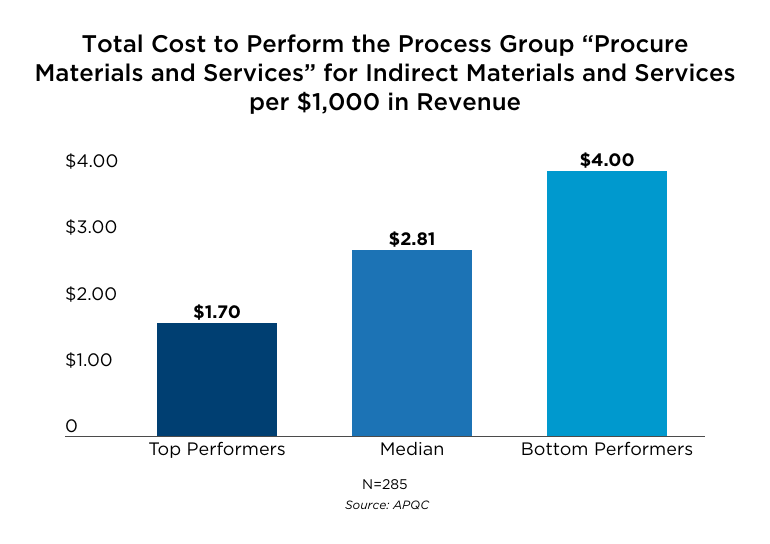
Fig. 3
Typical drivers that organizations examine when seeking to reduce process cost are organizational structure (e.g., the impacts on cost of centralization versus decentralization), technology (e.g., how to leverage technology and automation to reduce costs), strategic outsourcing of non-core tasks, and key practices related to the process (people practices, procedures, protocols, etc.). As far as organizational structure is concerned, APQC has found that centralized direct procurement functions tend to have lower procurement costs than decentralized functions. For indirect procurement, by contrast, decentralized approaches tend to have lower costs.
Also, process mapping is often a helpful exercise in process improvement. Going through the exercise of mapping key processes in procurement can help identify bottlenecks, redundancies, incomplete handoffs, missing process documentation, and opportunities to streamline activities.
Breaking down the total cost of procurement, APQC finds that labor is the primary cost component of the procurement process group. About 59% of organizations’ procurement costs go toward personnel costs (Figure 4).
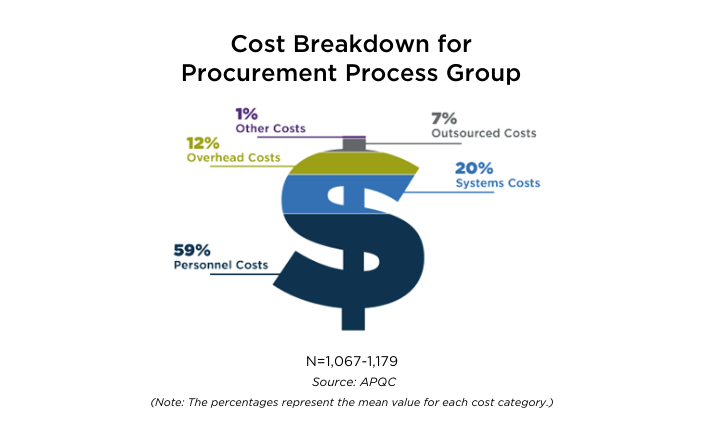
Fig. 4
Where is that time in procurement spent? As part of procurement, the process for ordering materials and services may seem straightforward, but it requires the largest investment of time for procurement professionals. APQC research shows that half (50%) of all full-time equivalent (FTE) employee time in procurement is allocated to ordering materials and services (Figure 5).
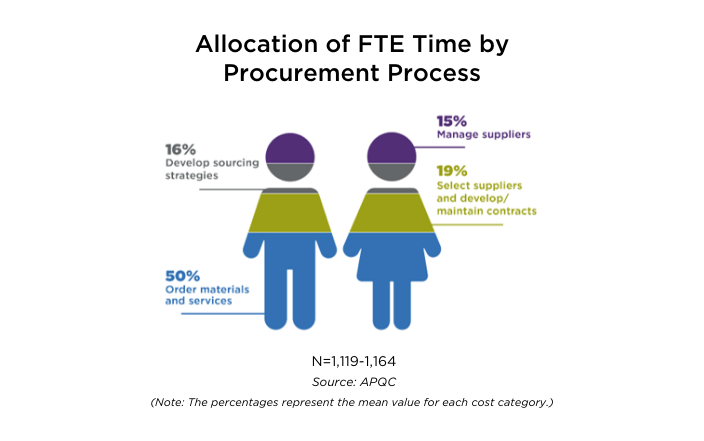
Fig. 5
About this Content
This content can include median values sourced from APQC's Open Standards Benchmarking database. If you're interested in having access to the 25th and 75th percentiles or additional metrics, including various peer group cuts, they are either available through a benchmark license or the Benchmarks on Demand tool depending on your organization's membership type.
APQC's Resource Library content leverages data from multiple sources. The Open Standards Benchmark repository is updated on a nightly cadence, whereas other data sources have differing schedules. To provide as much transparency as possible, APQC will always attempt to provide context for the data included in our content and leverage the most up-to-date data available at the time of publication.
c: 1784549754