How FinListics Solutions Wins Bigger, Data‑Backed Deals with APQC’s Benchmarks
“APQC was the Holy Grail. It let us do the ‘double-click’ and align benchmarks directly to client solutions. Access to APQC has made our approach more fact‑based and solution‑mapped to what buyers actually care about.”
-Dr. Stephen Timme, President of FinListics Solutions
The FinListics Solutions Case Study: For two decades, FinListics Solutions has helped enterprise sellers understand their customers and quantify value early in the sales cycle. Founder Dr. Stephen Timme, a former professor of finance turned consultant, saw a persistent gap: sellers could point to high‑level financial trends, but struggled to connect them to operational metrics and credible outcomes buyers would trust.
The turning point came more than a decade ago when FinListics integrated APQC’s benchmarking and data services into its ClientIQ platform.
The Result: repeatable, fact‑based sales conversations that map a vendor’s solution directly to the buyer’s KPIs with measurable impact on win rates, deal sizes, and pipeline.
The Challenge:
Traditional ROI talk tracks often sound like opinion. Sellers might claim they can reduce cost of goods sold or accelerate time‑to‑market, but buyers (especially finance) ask: “Based on what?”
Without trusted external benchmarks, conversations stay abstract, get stuck with a single stakeholder, or stall until a late‑stage “business case” that arrives too late to shape the vision. FinListics needed a way to operationalize credible benchmarks inside the selling motion; earlier, faster, and tailored to each stakeholder.
The APQC Solution: 3 Real‑World Examples

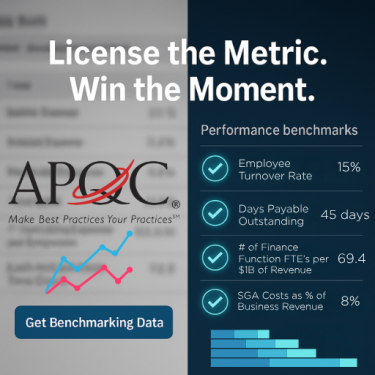
APQC’s third‑party‑verified benchmarking fills the credibility gap. FinListics maps APQC’s operational KPIs (e.g., materials cost as a % of revenue, scrap and rework, cross‑sell/upsell contribution) to the concrete value drivers of clients’ solutions. This reframes discovery as a fact‑based, stakeholder‑specific conversation, not a generic pitch.
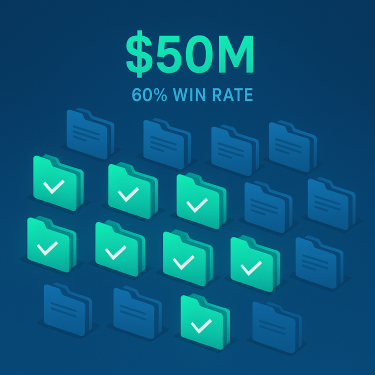
Example 1: Turning 15 proposals into 9 wins and $50M
“Benchmarks are a conversation starter: ‘If you closed just 1% of this KPI gap, it’s worth tens of millions.’”
-Dr. Stephen Timme
A technology‑focused consulting firm embedded FinListics Solutions' Client IQ platform and APQC data into early discovery and proposal development. Sellers led with financial performance and KPI gaps relevant to each stakeholder (e.g., IT and Finance and Accounting expenses, and indirect procurement) and translated a 1‑point improvement into financial impact at the client’s scale.
How they used APQC data: Benchmarks became the “double‑click” from high‑level strategy to the operational levers that a given solution improves. Teams opened with, “In your industry, the median for this KPI is X; if you’re at Y, closing one point is worth ~$Z.” The benchmarks served as a conversation starter and an invitation to compare with internal numbers.
The Outcome: 15 proposals submitted and 9 won: a 60% win rate worth ~$50M in total revenue impact. The firm credits the FinListics financial analytics and credibility and clarity of APQC data-anchored business cases for accelerating stakeholder alignment and de‑risking approvals.
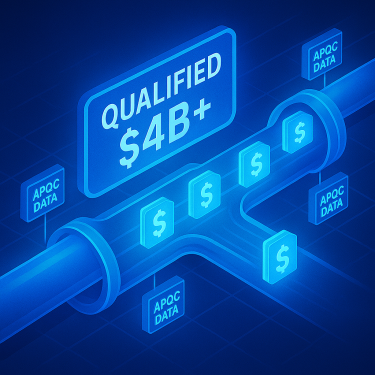
Example 2: Enterprise sellers scale pipeline to $4B+ per year
“We used to just call on the CIO. Now the aperture is open and we’re aligning IT with Marketing, Store Ops, Merchandising, and Finance around a shared, KPI‑anchored narrative. That’s why deal sizes go up.”
Multiple large go‑to‑market teams rely on FinListics + APQC data to consistently build qualified, multi‑stakeholder pipeline at scale.
How they used APQC data: Sellers moved from opinion to fact by tying solution benefits to APQC’s independently‑sourced KPIs (e.g., cross‑sell/upsell, inventory turns, scrap/rework). Finance and value engineering teams validated scenarios using conservative, directionally‑correct ranges.
Outcome: These teams report $4B+ of qualified pipeline created annually, attributable in part to leading with credible financial analytics and external benchmarks that withstand CFO scrutiny and keep deals moving.
Example 3: Breaking into whitespace with 5 new accounts and $2.5M in new ACV
“It’s a conversation starter. You’re not saying these are their numbers — it’s the first serve, not the final answer. Use it to earn engagement and then validate side‑by‑side.”
A technology provider used FinListics + APQC data to enter five whitespace accounts where they previously had no footprint.
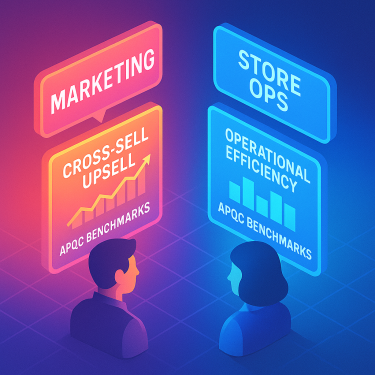
How they used APQC data: Instead of a one‑size message, reps tailored discovery for non‑technical stakeholders (e.g., Marketing, Store Ops). For Marketing, they anchored on APQC’s revenue benchmarks like customer churn, cross‑sell/upsell, and quantified a 1‑point lift at the prospect’s revenue base.
Outcome: Five new logos landed; with an average deal size around $500K, that was ~$2.5M in new ACV. Across a broader cohort, 90% of sellers using FinListics and APQC reported deals 25% larger as a function of engaging more stakeholders with KPI‑specific value.
Throughout these examples, the mantra is simple: use APQC data to open the aperture with credible, stakeholder‑specific KPIs — then invite the customer to validate with their own data. The aim isn’t perfection; it’s to be directionally correct and financially material early enough to shape the vision and the scope.
By operationalizing APQC inside your sales and consulting playbooks, you transform conversations: from opinions to evidence, from features to financial impact, and from single‑threaded pitches to multi‑stakeholder consensus.
APQC data‑anchored discovery helps sellers move beyond a single sponsor (e.g., CIO) to orchestrate consensus across Marketing, Store Operations, Merchandising, Supply Chain, and Finance — each with KPIs they own. The pattern we see:
- For smaller, simpler deals, teams often report cycle‑time reductions because data‑backed credibility cuts through noise early.
- For larger, transformational opportunities, cycles can lengthen — but deal sizes grow materially. In one enterprise, 90% of sellers using the platform reported deals 25% larger, driven by broader stakeholder engagement and KPI‑anchored scope.
Third party verified data matters. In a world awash in AI‑generated claims and unverified opinions, independent benchmarks change the conversation.
As Dr. Stephen Timme puts it:
“In a noisy world, APQC’s data is directionally correct, trusted, and doesn’t hallucinate… With APQC, sellers move from opinions to fact‑based conversations, trusted and verified.”
Together, APQC’s verified methodology and FinListics Solutions’ financial modeling de‑risk discussions with finance, speed internal alignment, and differentiate thought leadership.
Takeaways For Consultants:
Whether you’re advising on digital transformation, operational excellence, or post-merger integration, leveraging benchmark data with a globally recognized, neutral third-party database like APQC’s Open Standards helps you:
- Make value tangible early. Lead discovery with APQC’s independent benchmarks tied to the KPIs each stakeholder owns.
- Align recommendations with outcomes. Map offerings to APQC metrics (e.g., materials cost, scrap/rework, cross‑sell) and translate a 1‑point improvement into revenue, margin, cash, or cost impacts at the client’s scale. Win competitive pitches with hard numbers.
- Build consensus faster. Use common definitions and credible ranges to keep momentum across IT, Finance, and the business. Reduce costs and cycle time.
- Stand out in an AI world. Pair verified data with clear modeling to avoid “hallucinated” claims and pass CFO scrutiny. Prove the value of proposed changes.
And when the data comes from APQC, because of the stringent methodology and data validation process, you can be confident it’s rigorous, relevant, and respected.
Conclusion:
FinListics Solutions’ financial insights and decade‑long use of APQC benchmarks proves that third‑party‑verified data is not a “nice to have” for the company, it’s the connective tissue between your solution and the buyer’s outcomes.
By operationalizing APQC inside your sales and consulting playbooks, you transform conversations: from opinions to evidence, from features to financial impact, and from single‑threaded pitches to multi‑stakeholder consensus.
The payoff shows up where it counts: in higher win rates, larger deals, and resilient pipelines.
As Stephen reinforces it:
“APQC was the Holy Grail. It let us do the ‘double-click’ and align benchmarks directly to client solutions. Access to APQC has made our approach more fact‑based and solution‑mapped to what buyers actually care about.”
-Dr. Stephen Timme, President of FinListics Solutions

APQC's Professional Services Team is here to bring the data to you.
License Data
About the Author:
With over 30 years of experience at the intersection of data, consulting, and client success, Cathy Hill has been the go-to partner for professional services firms seeking to turn benchmarking and performance data into a powerful competitive advantage.
Since joining APQC in 1993, and through her time at Gartner working with Fortune 500 clients, Cathy has helped shape the business models and licensing strategies that power today’s APQC Open Standards Benchmarking® (OSB) platform.
Cathy is the architect behind APQC’s tailored offerings for consultants—from solo practitioners to mid-size boutiques to the Big Four. She’s worked hand-in-hand with these firms to design custom benchmarking packages that not only win engagements but deliver measurable ROI—often exceeding 20x the initial investment.
Cathy leads our product and service groups today, and her true passion remains helping consultants build practices that scale—using data to strengthen client outcomes and differentiate their offerings. She believes that when everyone has access to the same data, the real edge lies in how you use it. And she’s here to help you do just that.
🔍 What is Open Standards Benchmarking (OSB)?
OSB® is the world’s leading source for validated, standardized business performance data — designed to help organizations compare, improve, and transform their operations.
- Global Benchmarking Database
With more than 5.9 million data points from a majority of Fortune 500 and global organizations worldwide, OSB® delivers insights into performance across over 4400 metrics.
- Participation-Based Access
Organizations receive customized, no-cost performance reports in exchange for contributing data—freeing up budget to focus on analysis and improvement.
Standardized Process Framework
OSB® is built on APQC’s trusted Process Classification Framework® (PCF), ensuring consistent, apples-to-apples comparisons across industries and functions.- Speed Up Time-to-Value:
Immediately diagnose performance gaps and move directly to crafting high-impact solutions, demonstrating your value to the client from day one.
- Rigorous Validation
APQC applies a robust proprietary methodology to verify and normalize data, giving participants and their consultants confidence in the accuracy and credibility of results.
Flexible, Actionable Reporting
Results can be segmented by industry, size, geography, or a custom combination, and include quartile analysis, gap identification, and world-class performance benchmarks.- Unbiased Objectivity & Credibility:
Overcome internal resistance and subjective opinions with data from a neutral, globally respected third party. This elevates your recommendations from opinion to fact-based strategy, reinforcing your role as a trusted advisor backed by impartial evidence.
- Win More Business
Use validated performance data to support proposals, pitch decks, and transformation roadmaps.
- Accelerate Insights
OSB® quickly uncovers where your client stands and where the biggest opportunities lie—without starting from scratch.
Strengthen Stakeholder Trust
Reliable benchmarks build credibility and reduce resistance to change by providing objective, neutral 3rd-party insights.- A Powerful Client Acquisition Tool:
Differentiate your firm in proposals and initial meetings by citing APQC data, establish a data-driven approach, and present a clear, compelling case for engagement.
We turned to APQC for industry standards that proved very beneficial in preparing and selling our proposal to our client.

Contact us to explore a variety of benchmarking solutions tailored to your client’s needs.
Contact Our TeamLet's Collaborate
APQC has supported top consultancies and their clients worldwide. Want to strengthen your next engagement or proposal? Our benchmarking services and data licenses give you the insights to stand out and the credibility to lead change.
Whether you're running a one-person practice or a global consulting team, Cathy Hill and the APQC Professional Services Team can help you design a benchmarking and data package tailored to your needs, your clients, and your growth goals.
Reach out to our Professional Services team today: