Recently we worked with the leader of a large accounts payables group who had been asked by his CFO to comment on how their shared services accounts payable group matched up to benchmarks. In helping him answer that question we identified some very important principles to keep in mind when using quantitative benchmarks.
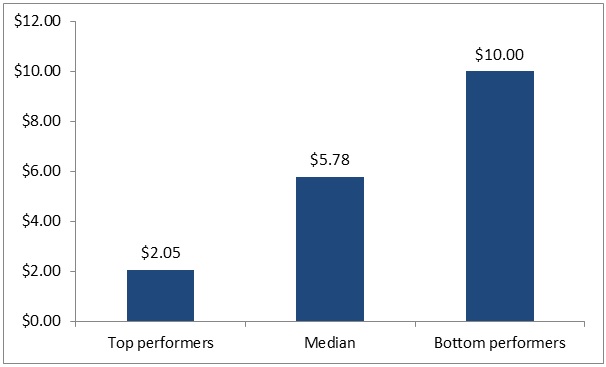
For example, let’s take a closer look at one financial management KPI and how to understand and leverage this metric. CFO Magazine posted their February 2018 Metric of the Month earlier this month−accounts payable cost per invoice processed−written by APQC CFO Perry Wiggins. A simple review of the related graphic (Figure 1) shows top performers (who are operating at the lowest cost) are processing at $2.05 per invoice. This is 2.8 times better that the median performers (who came in at $5.78 per invoice) and 4.8 time better than the bottom performers who came in at $10.00 per invoice).
First, know and understand the source of your data. Many organizations purport to have benchmarks and best practices data. Some sell it ala carte–so much a metric. Others have it bundled into finance wide reports. Still others imbed it in assessments as they seek to sell larger engagements. Regardless of the means by which it is presented, it is critical to understand where it came from and what it truly represents.
Second, how large is your sample size? In general, the larger the data set, the more likely it is to be representative of the total population. Anything less than twenty is likely too small to be representative. Getting a representative sample size is the hard work of benchmarking. Ask hard questions here. Also look to see if the producer of the benchmark regularly publishes the sample size. If they truly believe it is accurate, they will readily publish the sample size. The accounts payable data in the 2018 February Metric of the Month comes from a data set of 1,485 inputs. Look for “N = ___” on all your benchmarks.
Third, identify the data filters that can help you customize the information to make it more comparable. Examine the industry slices that can make for cleaner comparisons, look for size indicators to compare like sizes, and be able to examine geographic sorts. While each of these will reduce total sample size, they each can improve comparability.
Fourth, look for the qualitative ideas that help explain the quantitative results. While it is interesting to note that your cost per output is lower or higher than certain reference points, you need more to be successful. Your team needs to know what practices enable and promote that better performance.
With these in mind, let’s go back to the department leader whose CFO wants to know how the organization is doing. When you plot your performance it is certain that you will wind up in one of the four quadrants. If your department is not in the top quadrant managers often look to try to explain problems with the benchmarks. The filters can often help here to get a more apples to apples comparison.
Rather than get defensive, I would urge you to take a different approach. You can begin this immediately. Once you understand the metric being benchmarked (in this case the process cost of each accounts payable invoice), you can calculate your performance for the most recent period. You can also go back of the recent past as well as forecast expected future performance. From these past performances you can select your department’s personal best performance (much like any athlete can monitor their own “personal best effort”). I pick his point for starting as most organizations accept it as it is based on what has already happened. You know that you can perform at that level because you have already done so.
Then look around the rest of your organization to find peers who are doing the same thing. Compare your department’s personal best with theirs (in the Beyond Budgeting world we call this developing league tables). When you compare against all your peers, identify who the best is and share their practices to bring everyone up to their level.
After learning internally, then take the same benchmarking process to look externally both within your industry as well as outside of your industry. For this type of information, the Open Standards Benchmarking service from APQC is a great resource to help organizations establish a baseline of performance and compare themselves to a robust pool of validated benchmarks. Just as in athletics, winning is a combination of the best individual performers who most effectively blend together to perform as a team. If it costs you more to process accounts payable than your competitor, then you are draining funds from some other areas of the business.
Once your organization moves to the top of the external league tables, then you can continue your learning and development by expanding your benchmark comparison to focus on learning from world class best. The good news is that you can use this same guiding set of principles to interpret, understand, and leverage any finance KPI, not only AP cost per invoice. I look forward to sharing how your team is moving to the top, and I highly encourage you to check out the financial management benchmarking resources from APQC if you have not yet done so already.
About Steve Player: As financial management senior research fellow, Steve provides insights and thought leadership for APQC’s research and projects. Additionally, Steve serves as the North America program director for the Beyond Budgeting Round Table (BBRT). In this role, Steve works with BBRT member companies to implement continuous planning processes. Steve has more than 30 years of experience with improving performance management and implementing strategic planning processes. He is also the managing director of Beyond EPS Advisors, a business consulting firm, and founder of ABM SMART, and has co-authored several books including: Future Ready: How to Master Business Forecasting and Beyond Performance Management.