Number of claims processed per FTE that performs the process "process warranty claims"
This measure calculates number of warranty claims processed per full time equivalents (FTEs) that performs the process "process warranty claims". The Process "process warranty claims" includes [Identifying, investigating, and processes warranty claims. This process includes: receipt and validation of a warranty claim; definition and diagnosis /root cause analysis of an issue and recommendation for corrective action; the determination of responsibility for settlement of the claim; the transaction being approved or denied; and the originator being notified and payment authorized. In the case of a recurring event, further investigation (definition and diagnosis or root cause analysis) is performed, and a recommendation for corrective action is made and implemented in production/design. It ends when the claim is closed.]. This Process Efficiency measure is intended to help companies minimize waste and refine resource consumption related to the process "Process claim, adjustments, approvals and other service events".
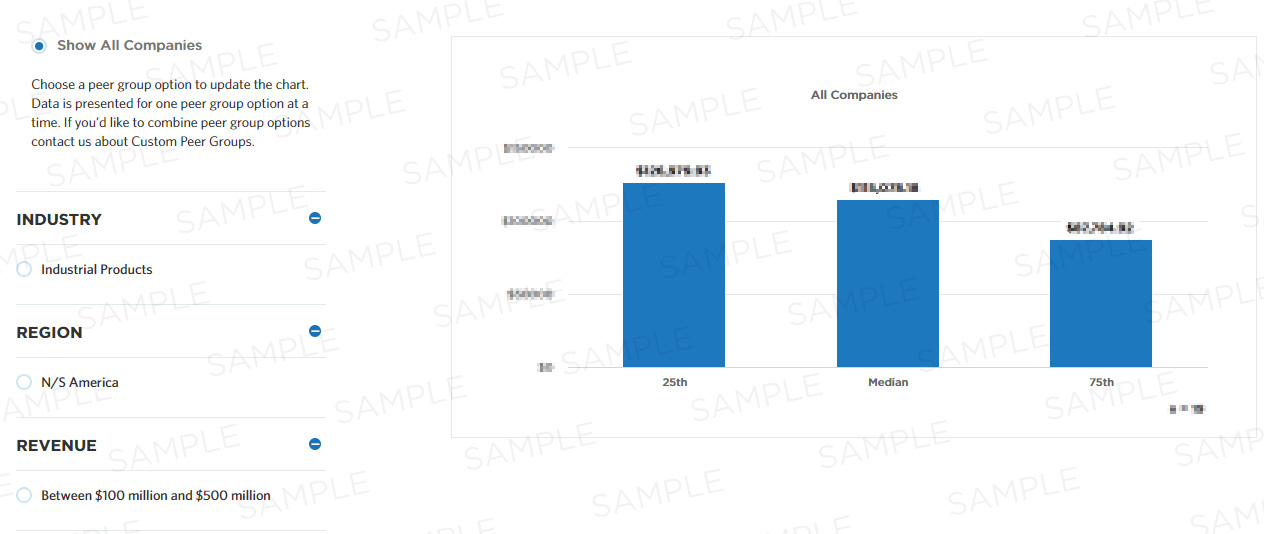
Benchmark Data
| 25th | Median | 75th |
|---|---|---|
| - | 2,111 | - |
Compute this Measure
Units for this measure are claims.
Total number of warranty claims processed /Number of FTEs who to perform the process "process warranty claims"
Key Terms
To calculate the number of full-time equivalents employed during the year for each respective process or activity, you must prorate the number of employees and the hours spent performing each process/activity. Assume that a full-time worker represents 40 hours per week. Provide the average number of full-time equivalents employed during the year for each respective process. Include full-time employees, part-time employees, and temporary workers hired during peak demand periods. Allocate only the portion of the employee's time that relates to or supports the activities identified for an applicable process. Prorate management and secretarial time by estimating the level of effort in support of each activity, by process.
For example, a part-time secretary in the finance department for XYZ, Inc. charges all of his time to finance department activities. He works 20 hours per week. The secretary splits his time evenly supporting employees working in the general accounting process and the financial reporting process. Thus, his time should be allocated by process. So, if he works throughout the year and supports these two processes, his time would be split evenly as:
20hrs/40hrs = .5FTE * 50% for general accounting = .25FTE for general accounting
20hrs/40hrs = .5FTE * 50% for financial reporting = .25FTE for financial reporting
Process efficiency represents how well a process converts its inputs into outputs. A process that converts 100% of the inputs into outputs without waste is more efficient than one that converts a similar amount of inputs into fewer outputs.
The metric value which represents the 50th percentile of a peer group. This could also be communicated as the metric value where half of the peer group sample shows lower performance than the expressed metric value or half of the peer group sample shows higher performance than the expressed metric value.