 At APQC, we’ve long argued that your knowledge management strategy should dictate decisions about technology, not the other way around. Companies that chase every new KM “solution” without a clear business case rarely get the results they’re looking for. But analysis of APQC’s benchmarking data shows that technology investment is an integral component of knowledge management success. More than ever, KM programs need state-of-the-art tools that make it easy for employees to share and access knowledge—and that takes money.
What the Data Says
This month, I want to talk about a metric from APQC’s Open Standard Benchmarking® database that shows that top-quartile KM programs spend $0.57 on KM technology per $1,000 revenue. By comparison, bottom-quartile KM programs spend $0.20 per $1,000. This means that firms at the high end of the spectrum invest nearly three times more than those at the low end, even when normalized by how much money they take in.
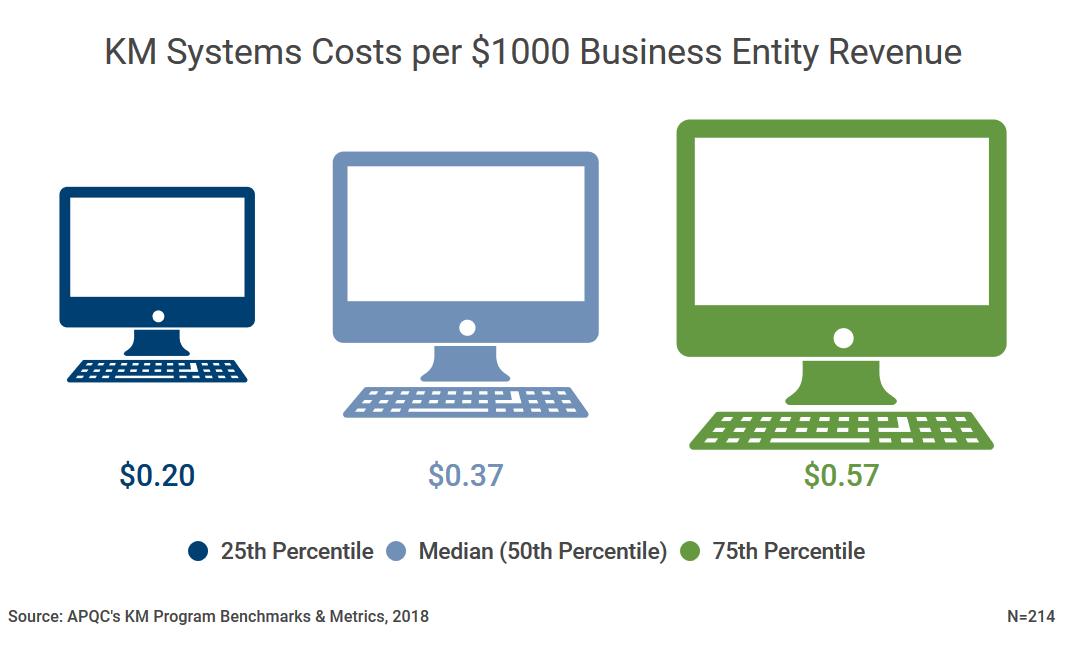 In most cases, KM inputs do not correlate with outputs. Spending more on KM does not necessarily result in higher participation or make the KM program more effective. One exception, however, is technology spend. Our analysis found that KM systems cost per $1000 revenue is correlated with the percentage of the KM target audience participating in at least one KM approach. When organizations spend more on KM technology, they get higher levels of engagement.
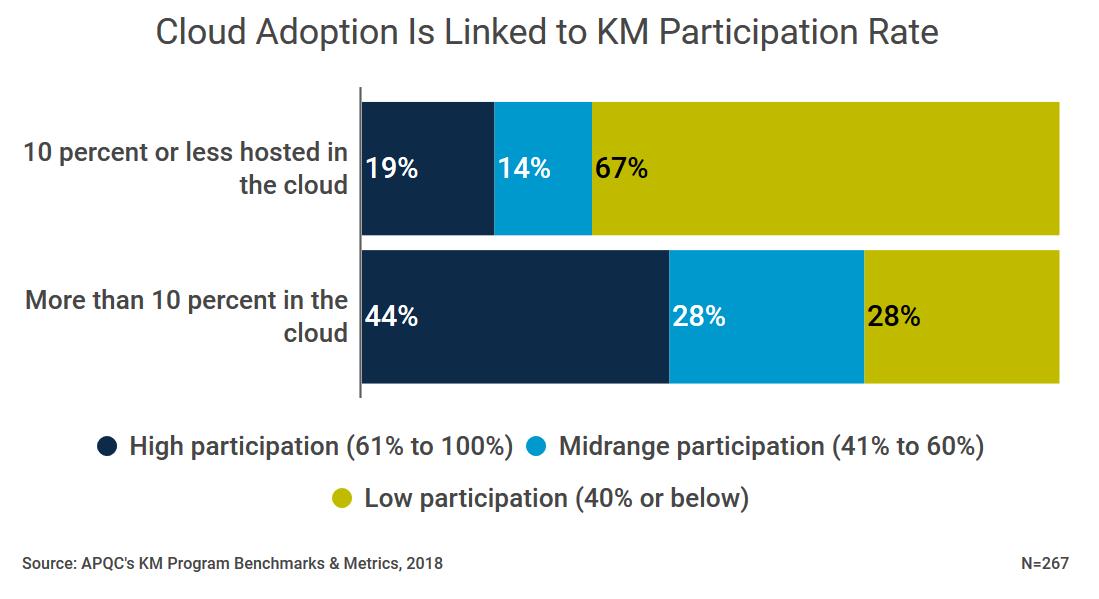
Participation rates are also higher when at least some KM applications are in the cloud vs. on premises. The proportion in the cloud does not seem to be particularly important, but KM programs with 10 percent or less of their software in the cloud have markedly lower participation rates than their peers. Although we can’t be sure, this may have less to do with the hosting model itself than the overall age and quality of KM systems. Since the cloud is a relatively new phenomenon, organizations that have not upgraded their technology recently tend to rely on more on-premises infrastructure.
 Acting on the Data
To stay ahead of the curve, review your portfolio of KM technologies at least annually and make updates in line with the KM strategy. For example, a lot of KM programs in our database use Microsoft SharePoint, but many have not yet migrated to SharePoint Online as part of Office 365 in the cloud. Given the additional capabilities available in O365, a move may make it easier for employees to contribute, collaborate, and reuse knowledge in the ways you want them to. The same is true for comparable offerings from other vendors.
Along with monitoring the technology landscape, keep an eye on employee feedback. This will tell you whether your existing systems are meeting expectations in terms of functionality, interoperability, and user experience. Knowledge technologies are evolving quickly, especially in the world of AI and bots. As vendors crank out the next wave of tools, your current offerings (especially on-premises ones) may “age out” more quickly than you’re used to. Employees are spoiled by slick B2C software, and they’re showing less tolerance for archaic, clunky enterprise systems.
Finally, don’t make your KM technology decisions in a vacuum. Bring your IT and digital workplace teams into the conversation to understand the implications of your choices and ensure they jive with broader IT and digitization strategies. This will help you optimize the current user experience and build adaptable infrastructure that will carry you into the future.
Read the full report from APQC’s KM Program Benchmarks & Metrics research.
Learn about APQC’s KM benchmarking database. Participation is free, and participants receive a customized report showing how their KM programs compare to others in their industry, revenue range, and region.