Percentage of initially planned functionality that is delivered for application development and maintenance projects in the most recent year
This measure calculates average percentage of initially planned functionality that was delivered for application development and maintenance projects fully completed during the past year. Application development involves end-to-end software development including requirements analysis and management, design, development, verification, and validation of solution. Maintenance follows the delivery of an engineered solution. This measure is part of a set of Process Efficiency measures that help companies in obtaining the greatest saving and performance by minimizing waste and optimizing resource consumption.
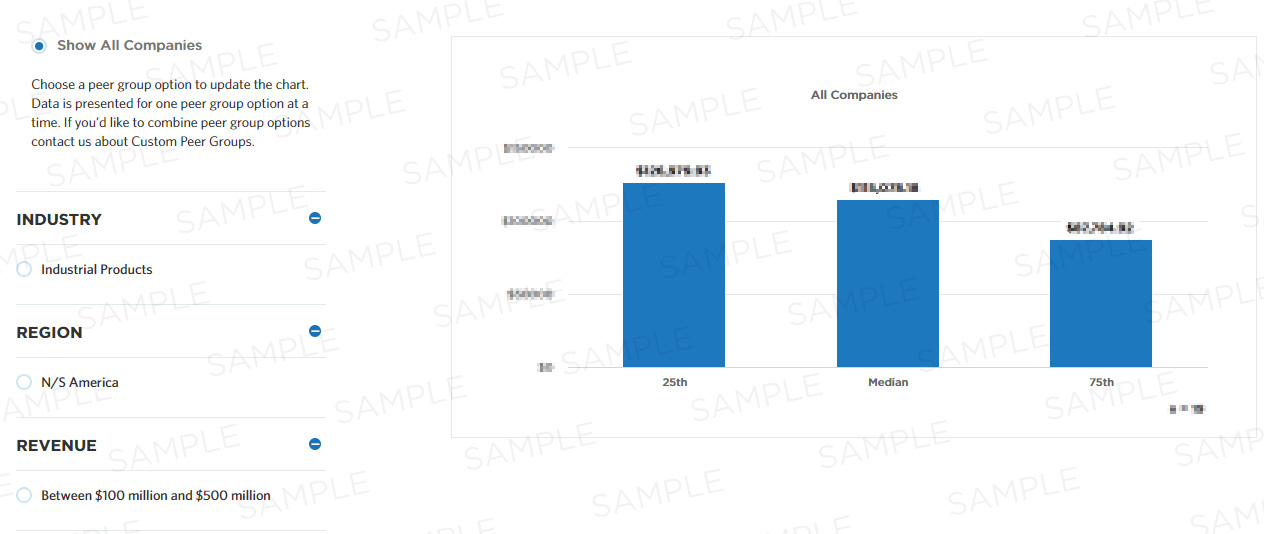
Benchmark Data
| 25th | Median | 75th |
|---|---|---|
| - | - | - |
Compute this Measure
Units for this measure are percent.
Percentage of initially planned functionality delivered for application development/maintenance projects in the most recent year
Key Terms
Process efficiency
Process efficiency represents how well a process converts its inputs into outputs. A process that converts 100% of the inputs into outputs without waste is more efficient than one that converts a similar amount of inputs into fewer outputs.
Median
The metric value which represents the 50th percentile of a peer group. This could also be communicated as the metric value where half of the peer group sample shows lower performance than the expressed metric value or half of the peer group sample shows higher performance than the expressed metric value.